


📊 The Performance panel in Browser DevTools helps you analyze your web app's performance. It records detailed CPU profiles showing exactly where time is spent, helping you identify slowdowns and optimize your code for better speed.
Web Vitals is an initiative by Google to provide unified guidance for quality signals that are essential to delivering a great user experience on the web.
The Web Vitals initiative aims to simplify the landscape, and help sites focus on the metrics that matter most, the Core Web Vitals.
Core Web Vitals are the subset of Web Vitals that apply to all web pages, should be measured by all site owners, and will be surfaced across all devtools. Each of the Core Web Vitals represents a distinct facet of the user experience, is measurable in the field, and reflects the real-world experience of a critical user-centric outcome.
To ensure you're hitting the recommended target for these metrics for most of your users, a good threshold to measure is the 75th percentile of page loads, segmented across mobile and desktop devices.
The Performance panel helps you analyze and optimize your web application by:
Two key rules for fast JavaScript applications:
⚡ While reducing JavaScript size helps performance, how you execute code matters more.
🎯 Browser tasks include:
The event loop is an important concept in JavaScript that enables asynchronous programming by handling tasks efficiently. Since JavaScript is single-threaded, it uses the event loop to manage the execution of multiple tasks without blocking the main thread.
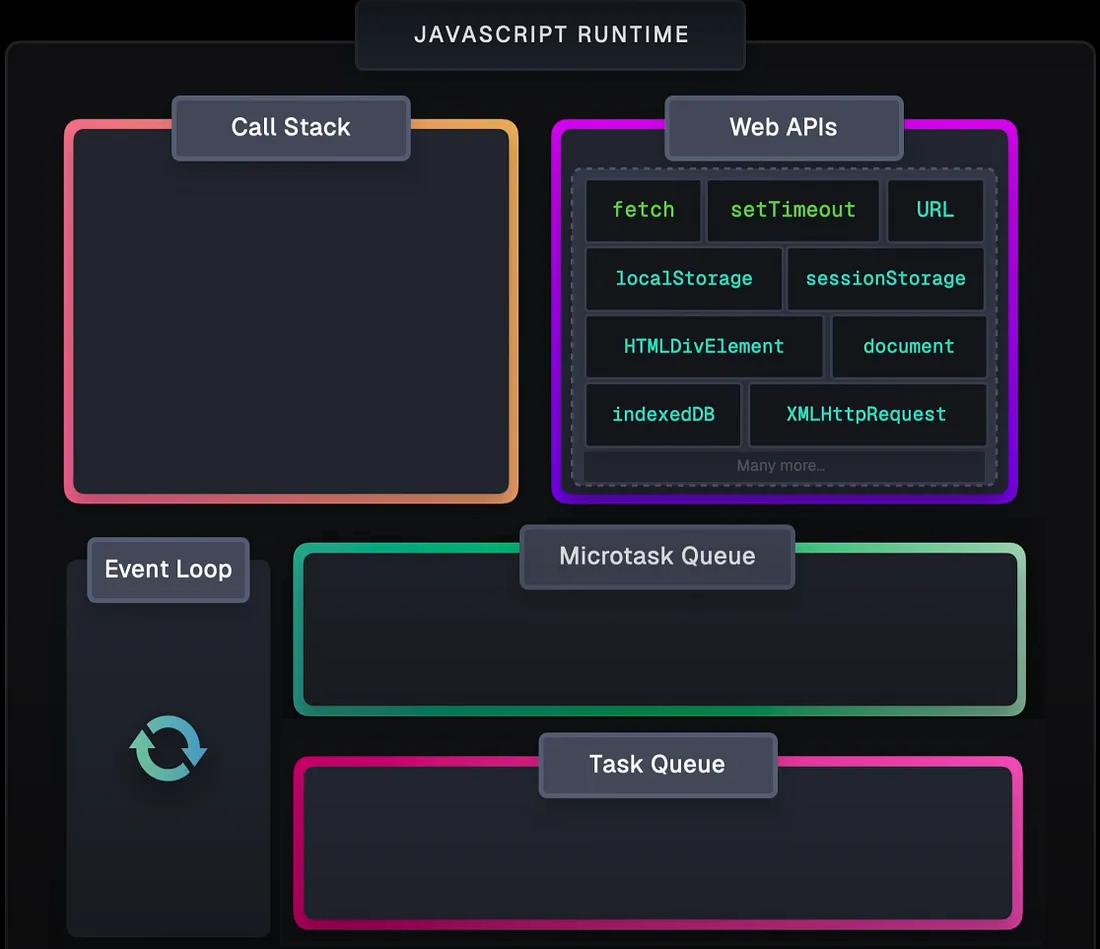
When a task is completed, the event loop checks the task queue for any pending tasks. If there are tasks in the queue, the event loop picks the first task and executes it. This process continues until all tasks in the queue are processed.
JavaScript uses a callback queue to manage asynchronous tasks. When an asynchronous task is completed, its callback function is added to the callback queue. The event loop checks the callback queue and executes the callback functions in the order they were added.
JavaScript uses a microtask queue for tasks that need to be executed immediately after the current task. Microtasks include promise callbacks and mutation observer callbacks. The event loop processes the microtask queue before moving on to the callback queue.
In summary, the event loop is a mechanism that allows JavaScript to handle asynchronous tasks efficiently by managing the execution of tasks in a single-threaded environment. It uses a callback queue for asynchronous tasks and a microtask queue for tasks that need to be executed immediately after the current task.
Here's a simple example to illustrate how the event loop works:
Output:
        Start
        End
        Promise Resolved
        setTimeout Callback
In this example:
console.log("Start") executes first.setTimeout schedules its callback but does not execute it immediately.Promise.resolve().then() is placed in the microtask queue and executes before the callback queue.
Tasks longer than 50ms are long tasks, and their blocking period affects user interactions. Breaking up long tasks into smaller ones allows the browser to respond to higher-priority work sooner.
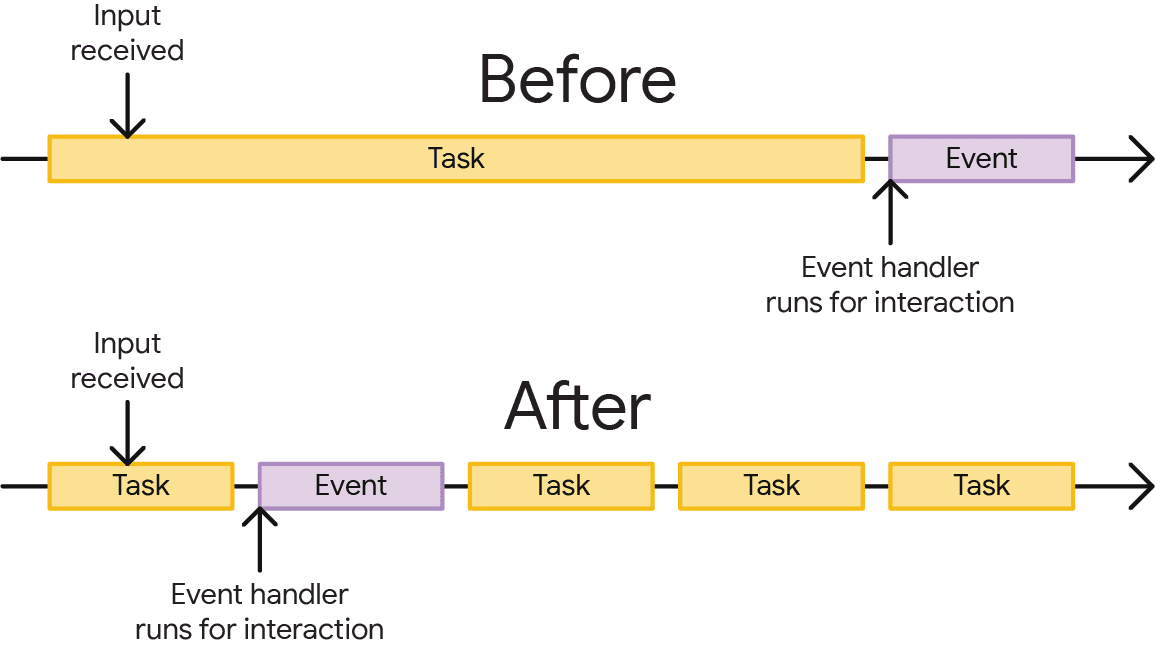
By breaking up tasks, the browser can handle user interactions more efficiently, making the interface feel more responsive.
This method is straightforward and useful for measuring the time taken by a specific block of code.
The Performance API provides more detailed and precise measurements.
For high-resolution time stamps, performance.now is a great option.
It all about finetuning the performance of your code. The above methods are just a few examples of how you can measure and optimize performance in your JavaScript code. Depending on your specific use case, you may need to experiment with different approaches to find the best solution for your needs.
mineBitcoin() call run ~5x faster?This is due to V8's JIT (Just-In-Time) compiler optimization:
mineBitcoin and calculateSum. The code runs as highly optimized native code from the start.calculateSum appear only once in the flame chart?TurboFan inlines calculateSum directly into mineBitcoin's loop body. Instead of making 100 million separate function calls, the addition (currentResult + currentValue) is placed directly inside the loop. That's why the flame chart shows calculateSum only once rather than as millions of individual calls — the function call overhead is completely eliminated.
| First call | Second call | |
|---|---|---|
| Engine | Ignition (interpreter) → TurboFan compiles mid-run | TurboFan (optimized) from start |
| Inlining | Not yet applied | calculateSum inlined into loop |
| Time | ~500ms | ~94ms |
💡 This is why benchmarking in JavaScript requires "warm-up" runs — the first execution profiles and compiles, subsequent ones benefit from the optimized code.
The Timeline overview lets you create multiple nested breadcrumbs in succession, increasing zoom levels, and then jump freely between zoom levels.
To declutter the flame chart in the Main thread, you can hide selected functions or their children:
In the Main track, right-click a function and choose one of the following options or press the corresponding shortcut:
Annotations help document and analyze specific events during performance analyzing.
To add a Lable to an entry, right-click on the element and select "Lable entry".
To add a link to another entry, right-click on the element and selete "Link entreis".
To define time range, Shift and drag the flame chart.
On the Timings track, view important markers such as:
The flame chart in the Performance panel uses different colors to represent different types of activities:
The height of each bar in the flame chart represents call stack depth, while the width shows how long that particular function took to execute.